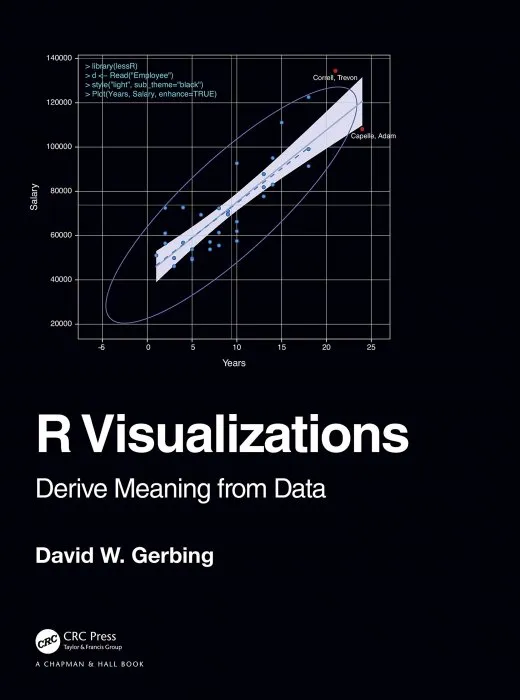
R Visualizations: Derive Meaning from Data
Date: May 12, 2020
ISBN: 1138599638
Language: English
Number of pages: 249 pages
Format: EPUB
Add favorites
R Visualizations: Derive Meaning from Data focuses on one of the two major topics of data analytics: data visualization, a.k.a., computer graphics. In the book, major R systems for visualization are discussed, organized by topic and not by system. Anyone doing data analysis will be shown how to use R to generate any of the basic visualizations with the R visualization systems. Further, this book introduces the author’s lessR system, which always can accomplish a visualization with less coding than the use of other systems, sometimes dramatically so, and also provides accompanying statistical analyses.
Key Features
Presents thorough coverage of the leading R visualization system, ggplot2.
Gives specific guidance on using base R graphics to attain visualizations of the same quality as those provided by ggplot2.
Shows how to create a wide range of data visualizations: distributions of categorical and continuous variables, many types of scatterplots including with a third variable, time series, and maps.
Inclusion of the various approaches to R graphics organized by topic instead of by system.
Presents the recent work on interactive visualization in R.
Download R Visualizations: Derive Meaning from Data
Similar books
Information
Users of Guests are not allowed to comment this publication.
Users of Guests are not allowed to comment this publication.